March 9, 2015
This article is the summary of a presentation made by Vikram Aggarwal, CEO of EnergySage, during a conference call hosted by UBS. This summary was prepared by UBS and shared via email.
Understanding DG Trends via the EnergySage online platform
We held our latest conference call with Vikram Aggarawal, CEO of the EnergySage.com solar platform, the preeminent online shopping platform for consumers to compare loan vs. lease options. Solar remains a relatively opaque industry, with many potential customers 'sold' solar rather than pursuing solar, allowing vendors to dictate savings for consumers. While offers vary widely by jurisdiction, shopping online produces 10-15% greater savings for consumers; with most deals today offering ~20% discounts vs. their utility bills, whereas EnergySage appears to offer upwards of ~30% when shopped across multiple offers. Interestingly, for those pursuing 'community solar', the savings are the least at just ~10%, typically marketed to those ineligible for rooftop (renters, apartments). Bottom line, we remain concerned around structural margin pressures on residential solar vendors as customer awareness of offerings increases, particularly with greater awareness of EnergySage and other similar price-shopping platforms.
The Loan vs. Lease Debate – a further illustration of margin pressure
We link the rising preference for solar loans, where customers buy (and borrow) against the system outright, rather than leasing to a wider push to keep vendors honest on passing through panel cost reductions rather than dictating prices via discounts off utility bills. With discounts to customers having declined modestly, rather than passing alongside the full benefits of lower solar installation costs, the disparity in savings between owning and leasing systems has seemingly increased meaningfully. EnergySage, estimates 70-75% of customers opt for loans now, when compared side- by-side, similar to the ~2/3rds quoted by SunPower in their latest 4Q release. Within these sales roughly half are via unsecured loan products, with the balance with more complicated (and cheaper) first- and second-lien products. We expect the cost of financing to become even more competitive as the ability to securitize these loans into securitizations (ABS) becomes pervasive. Following SCTY's example, NYLD confirmed it would likely seek such structures on its capitalization of portfolios sold down from NRG.
What's the analogy to the retail electric sector – it's all about sales channel
Akin to the intense competition we've already seen take hold in the ERCOT electric retail market, sales channels are centrally important to the margin proposition. Electric sales done online see near no margin, with all offers on the Powertochoose.org website seemingly designed to provide long-dated benefits to suppliers who are betting customers who choose to shop after their upfront low rates expire. In contrast, door to door rates, among other venues customers choose to shop offer up to 30% margins. We expect this bifurcation to exist to an even greater extent as penetration remains low. Notably, we flag customer acquisition costs are significant for the most lucrative door-to-door opportunities, where costs can be $3k-$6k/residential customers. The question will be whether customer education for solar becomes more meaningful, as taking the decision to sign up for a 20-year commitment more seriously than a short- tenor electric contract. Bottom line, intense competition and limited customer awareness are two key lessons for the solar world from the electric retailer experience.
Where is solar sold today? Online platform yields clues
Leveraging the wealth of data available from this online platform, EnergySage emphasized the most significant opportunities it saw were across the Northeast, with NY the 'hottest' of late. While the platform transacts just 2-3% of industry volumes, markets in which it operates are indicative of underlying solar economics- and sales acceleration. Notably, EnergySage has seen promising trends in Texas, likely in West Texas where solar irradiance is among the highest in the country, alongside the cheapest installed $/Watt costs. When coupled with panels facing Westwards to peak shave, rates offered appear to compete with 8-9¢/KWh range.
Loan vs. Lease debate will shift with the ITC step-down
Among the key points in evaluating the trend towards buying via loan in lieu of a lease is the step-down to 0% for the residential ITC, vs. the step-down to 10% for the business ITC at the end of 2016. We see this as an important discrepancy, reflecting the greater need for the ITC at larger utility-scale vs. the net metering subsidies available for smaller residential installations. We suspect this will play out favoring leasing options, which can continue to capitalize on the 10%, vs. the individual who will no longer.
Declining costs do not benefit all consumers equally.
Customers haven’t fully benefited as solar costs continue to decline
According to EnergySage data, cash prices on an average were close to $5/kw three years ago, and have now come down to mid-$3’s, a ~30% or so drop. However, Vikram said that lease prices have remained constant. Installers price their systems based on what they expect customers are willing to pay, rather than their underlying costs (generally in the 20, 30% discount vs. current electricity bills). This also leads to cost differentials across regions as rates vary significantly across service territories due to differences in taxes, volumetric rates, etc. This is in turn the primary driver behind the latest trend towards loans rather than leases, seeing the benefits under this scenario as disproportionately accruing to those pursuing loans.
Cost of solar varies widely by state
We include a chart below illustrating the significant variations in cost by state from the EnergySage presentation. Key to this chart is the low cost in states like Texas, where variable rates are among the cheapest in the country. Mr. Aggarwal emphasized costs in this region had been as low as $2.50/Watt in some regions, reflecting the lower cost of installation. We continue to see the bulk of cost reduction in residential solar as tied to declining installer costs, seeing Germany as a notable datapoint in its low relative cost vs. the US (upwards of ~40% cheaper according to some estimates).
Could loans force leasing companies to offer wider discounts?
The trend towards loans could very well be the 'forcing mechanism' for leasing companies to offer wider discounts. While leasing will always come at a premium to loan products, particularly for marginal customers with weaker FICO scores, it remains unclear how wide this delta will remain down the line.
What kinds of loans are available?
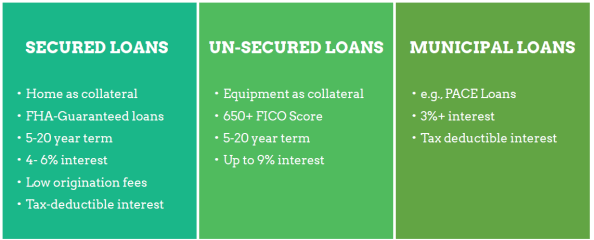
We include a brief comparison of the types of loans available to consumers. The key question for many remains whether to pursue secured or unsecured products. In specific states, customers can also choose from subsidized state loan products. Property Assessed Clean Energy (PACE) is available to customers in California; the state of CA still constitutes roughly ~half of all incremental DG home sales, and ~35% for EnergySage, making this particular subsidy program quite relevant. In Hawaii, customers can opt for the Green Energy Market Securitization Program (GEMS) solar product. These discounted loan programs are typically geared towards customers with relatively lower credit quality.
Unsecured loans should increase solar penetration further
Many consumers are choosing the unsecured loan options, which allows the installer to pay an origination fee of about 10 to 20% of the value of the solar PV system to the loan provider and buy down the loan to as low as 2.9% in interest; typically with a duration of 10 to 20 years. Assuming they qualify on the FICO score, the process is very straight forward for the customer. Further, if the consumer qualifies and can take the ITC, then for the first 12 to 18 months, the loan equals the amount of the ITC, mostly at low to no explicit interest cost.
Solar LCOE can be as low as 1-2 cents/kw in Massachusetts
In Massachusetts, factoring in the ITC and Solar Renewable Energy Credits (SRECs) over a 20 year period, EnergySage estimates the solar LCOE is as low as 1-2 ¢/kwh. In New York, with ITC income fund rebates built into the economics, the LCOE is an amazingly low ~3-4 cents/kwh. In the lease model in these markets, the lease provider is looking to charge somewhere between 10 and 12 cents with an escalator of 2 to 3% for the 20 year duration. We suspect the current levels of LCOE are unsustainable and reflect transitional economics for these products as solar subsidies are scaled back in the next couple years.
How do the numbers stack up? Looking at an illustrative example in MA
We illustrate the results from EnergySage's web platform for a typical Massachusetts consumer with a $100/mo bill. While clearly paying cash will always be the lowest cost option (without consideration for fungible alternatives for cash deployment), it's notable to see the wide disparity between the loan vs. lease. The $0-down loan reflects the leveraging of the entire project, including the 30% ITC tax credit. The most aggressive financing programs will offer very low, or interest-free short-duration loans to customers to bridge them until the receipt of the ITC benefits.
Illustrating the Extent of DG Penetration: Where does EnergySage Operate?
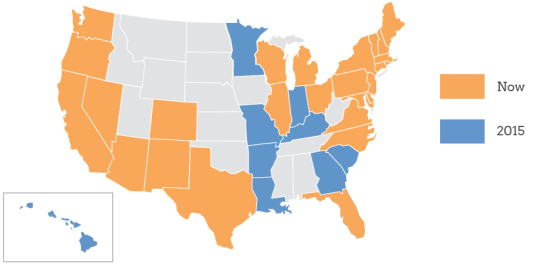
Illustrating the wide breadth of markets where DG economics remain interesting, we include a map of both existing and prospective DG markets in which EnergySage operates. While they operate in Florida today, anecdotally the company reports limited sales in this jurisdiction.
Similarly, this does not reflect market penetration 'reversal' when the 30% ITC drops down at the end of 2016. We would expect this map to reflect fewer states in 2017+.
For further background on Solar opportunities:
- Background on Tax Equity Matters – How much does it cost?
- BNEF's take on the solar outlook – US capacity and cost trends
- DG Policy outlook with SunRun - Weighing in on net metering
- The US Solar Policy outlook with SEIA – ITC and trade prospects
- How Cheap can Solar Get? NREL's Take – Why are costs coming down?
- Cracking the Carbon Code – Thoughts on 111(d) compliance at NARUC
- NRG: Picking Apart the Solar Opportunity – The Economics of Solar DG
